1. Overview
This design started life as an exercise to look at my carbon footprint, with a view to looking at how I can reduce my impact on earth's resources, especially fossil fuels. It later evolved into a design looking at how to make better use of my time and energy.
2. Choosing a methodology
Initially I didn’t use a methodology, as this started as a small exercise. But as the exercise developed, I realised its significance and then chose to make it into a proper permaculture design. The data collection was quite straight forward, so I chose CEAP as my methodology.
3. Working through the methodology
Collect information
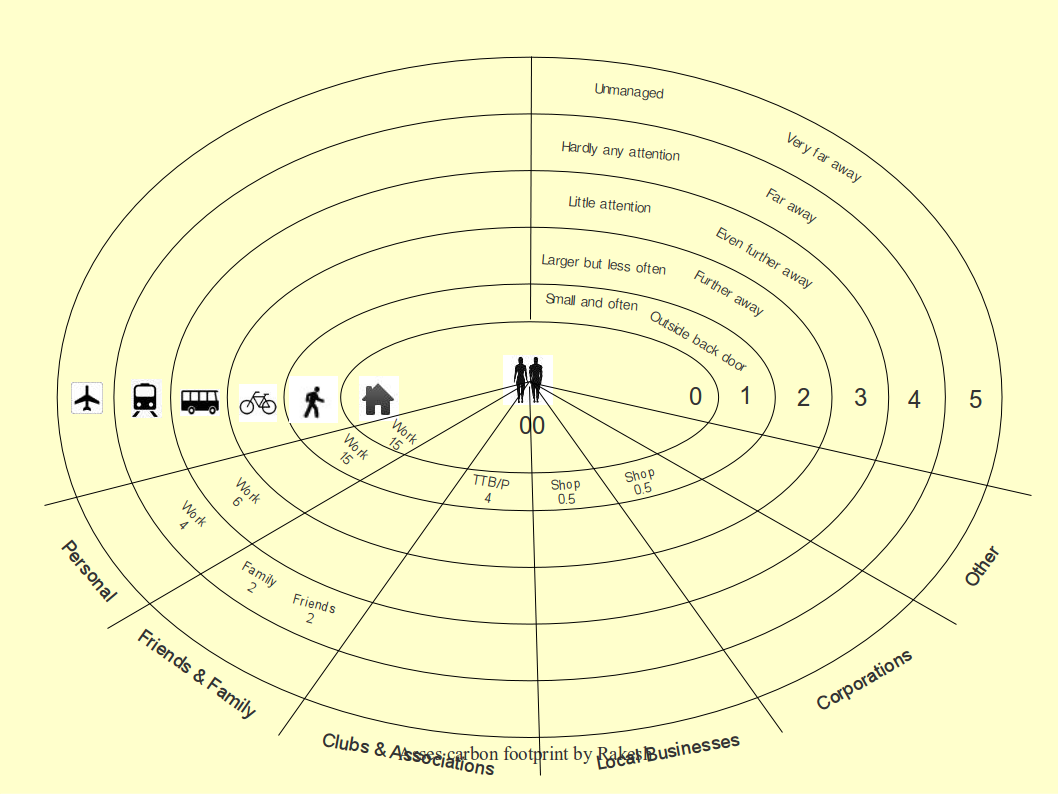
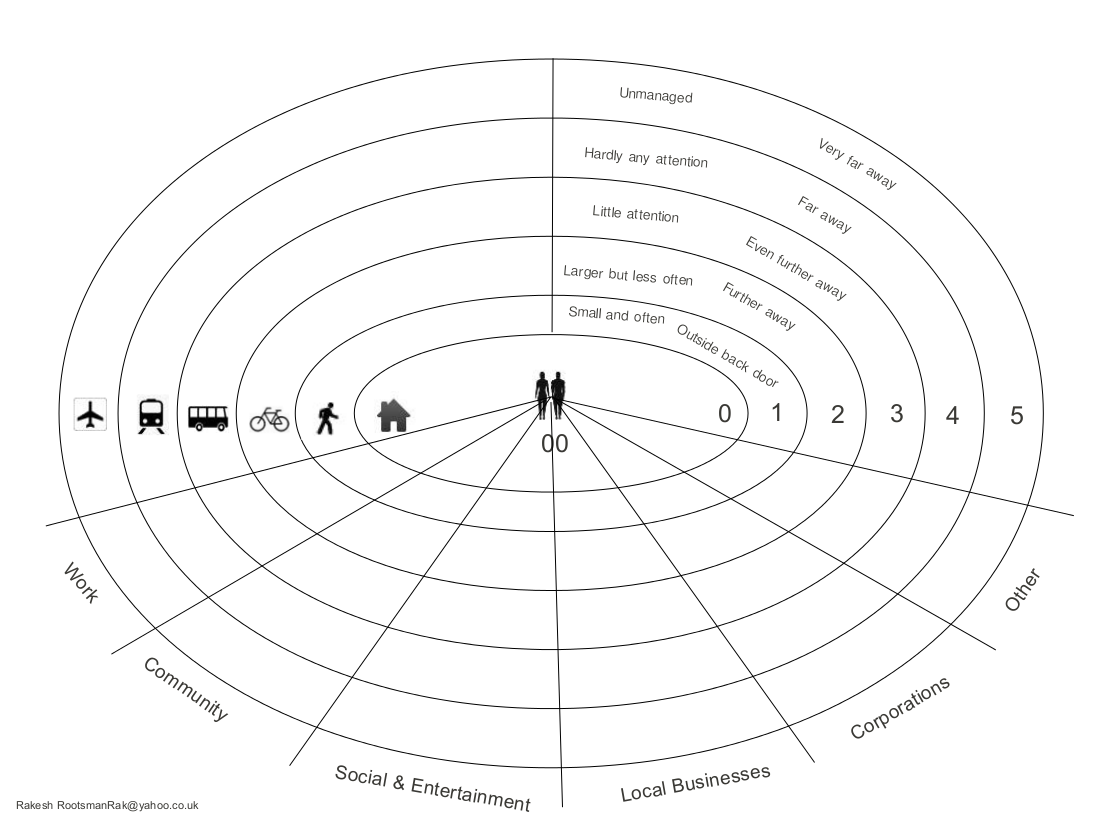
The exercise started with a zones and sectors analysis of my weekly travel activities, looking mainly at the time I spent travelling by different means. I took the zones and sectors tool and replaced the zones with different forms of transport according to their energy efficiency. So walking and cycling become zones one and two, local transport, long distance transport and flying become zones 3, 4 and 5 respectively. The sectors I translated into work (which with hindsight would have been better to classify as work), friends and family, clubs and associations, engaging with local businesses, engaging with corporations, plus an extra field just in case called other. I then took this interpretation of zones and sectors and used it as a teaching tool, which I converted into a slide presentation.
The slide show was adjusted so that I could use it to teach zones and sectors in its conventional format initially, and then goes on to showing how to apply it to an urban environment. When using this to teach, I make a point of explaining how this is a great example of taking an existing tool and applying it (with a few creative adjustments), to a subject that it was not intended for. I should point out I got this idea from an article I glanced upon LONG before I studied permaculture, and it stuck with me.
I have included the last page of the zones and sectors presentation, as well as the full slide show below
Concluding zones and sectors analysis page
The full zones and sectors slide show
Please note, I realised I missed out the conventional sectors in this presentations. Given the time it took to create, I found it was easier, quicker and more creative to do this presentation on a board, so I stopped using this presentation. So this presentation became obsolete and slightly incomplete. However I thought I would include it here as it is part of the design, and goes to show that using a tool which takes too much energy is often not a good tool. There comes a point where you have to decide to stop working on or with a tool, and use something more simple or appropriate for the job.


Blank zones and sectors worksheet
I often invite students to conduct this exercise for themselves during a PDC or at home, hence I have created a blank sheet for them to speed up the session
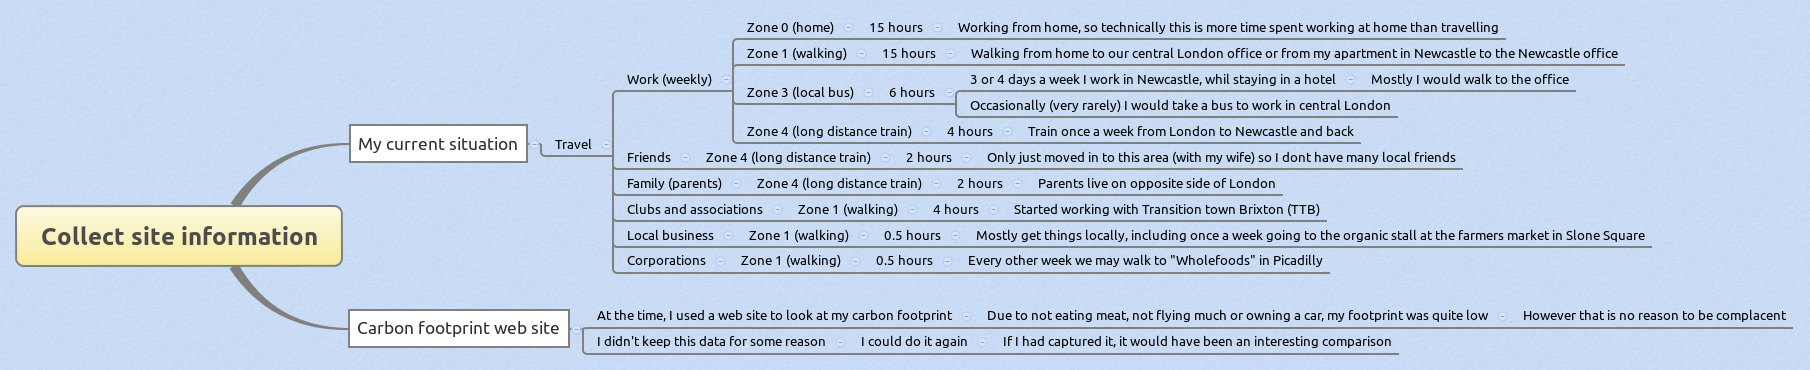
Mind mapping the rest of the design process
After adjusting the zones and sectors analysis, the rest of the design progressed as per my normal mind mapping process. Find below an interactive freemind mind map which contains the rest of the information gathered during the collect information stage.
Click on the image below to view an interactive freemind mind map
I have also included, the original xmind mind maps for reference.
Click on the image below to view the static Xmind mind map image
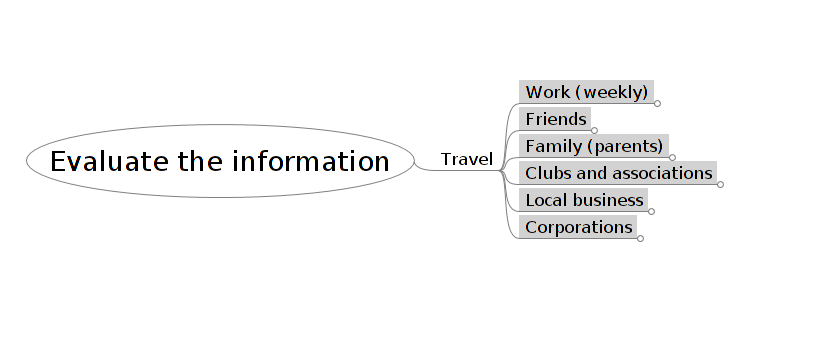
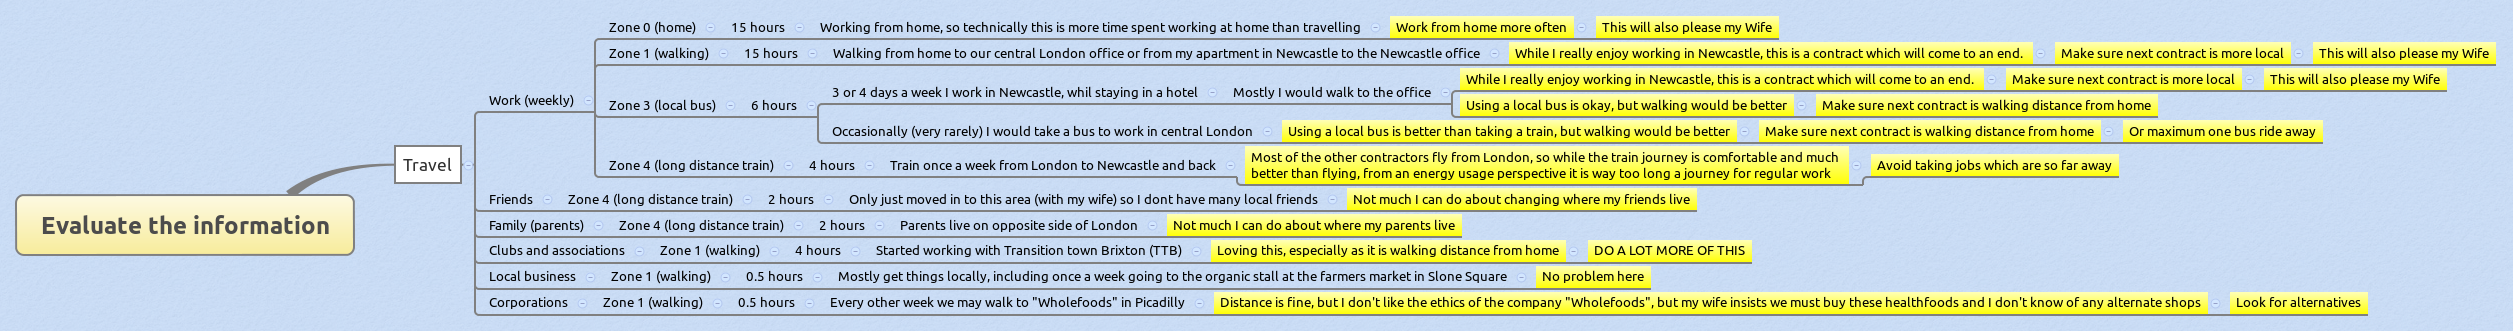
Evaluate
Having collected information for the design, the next stage it to evaluate and make sense of it. This interactive freemind map covers the evaluation.
Click on the image below to view an interactive freemind mind map
Click on the image below to view the static Xmind mind map image
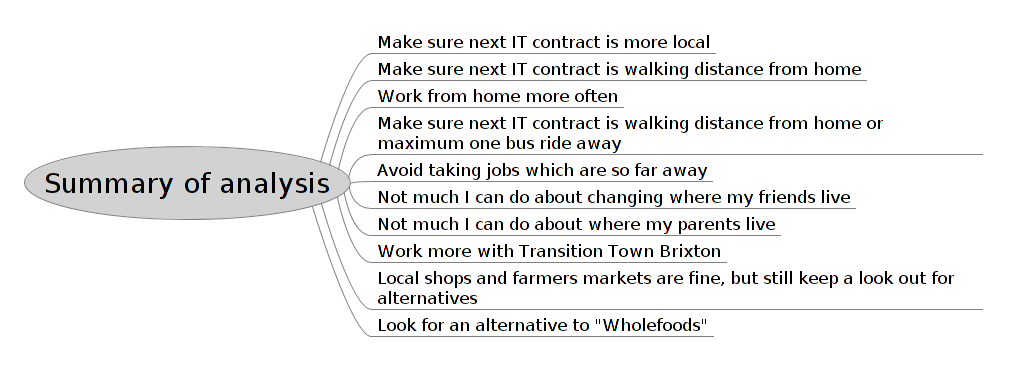
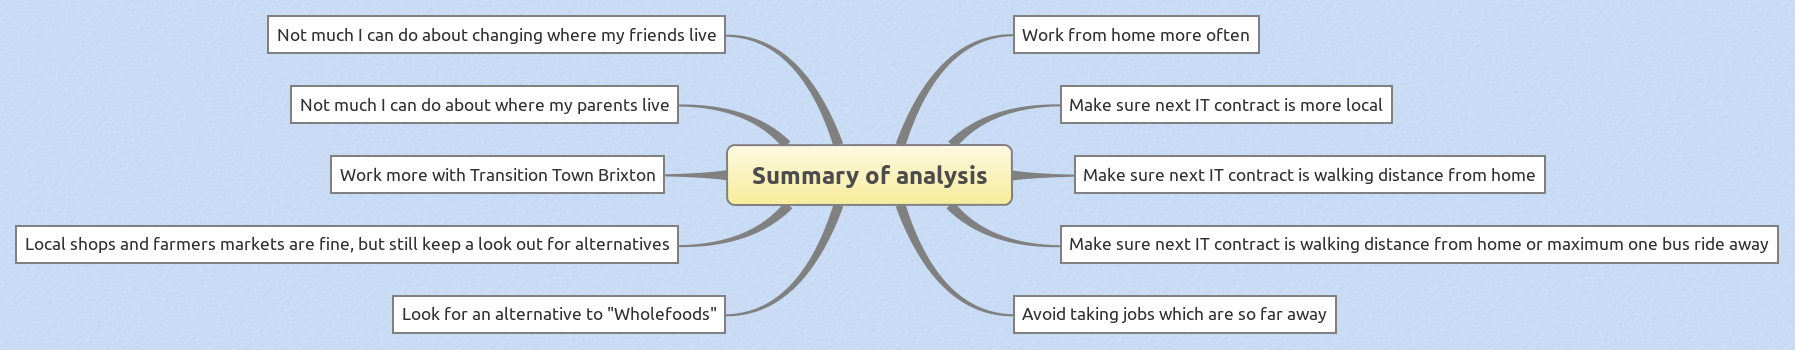
Summary of the evaluation (analysis) process
Here I take all the points highlighted from the previous stage (i.e. the parts highlighted in yellow in the last xmind mind map), and reorganise and summarise them to prepare them neatly for the next step.
Click on the image below to view an interactive freemind mind map
Click on the image below to view the static Xmind mind map image
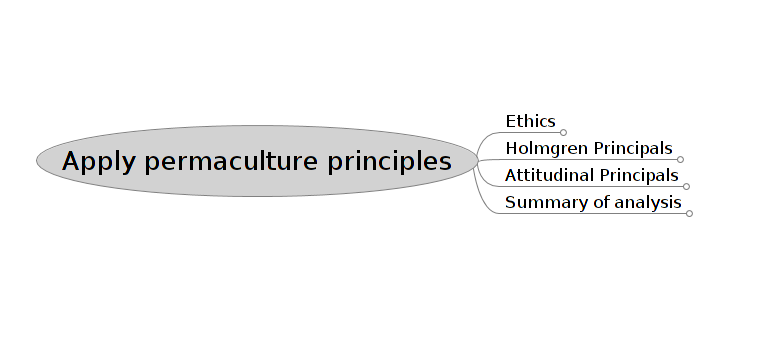
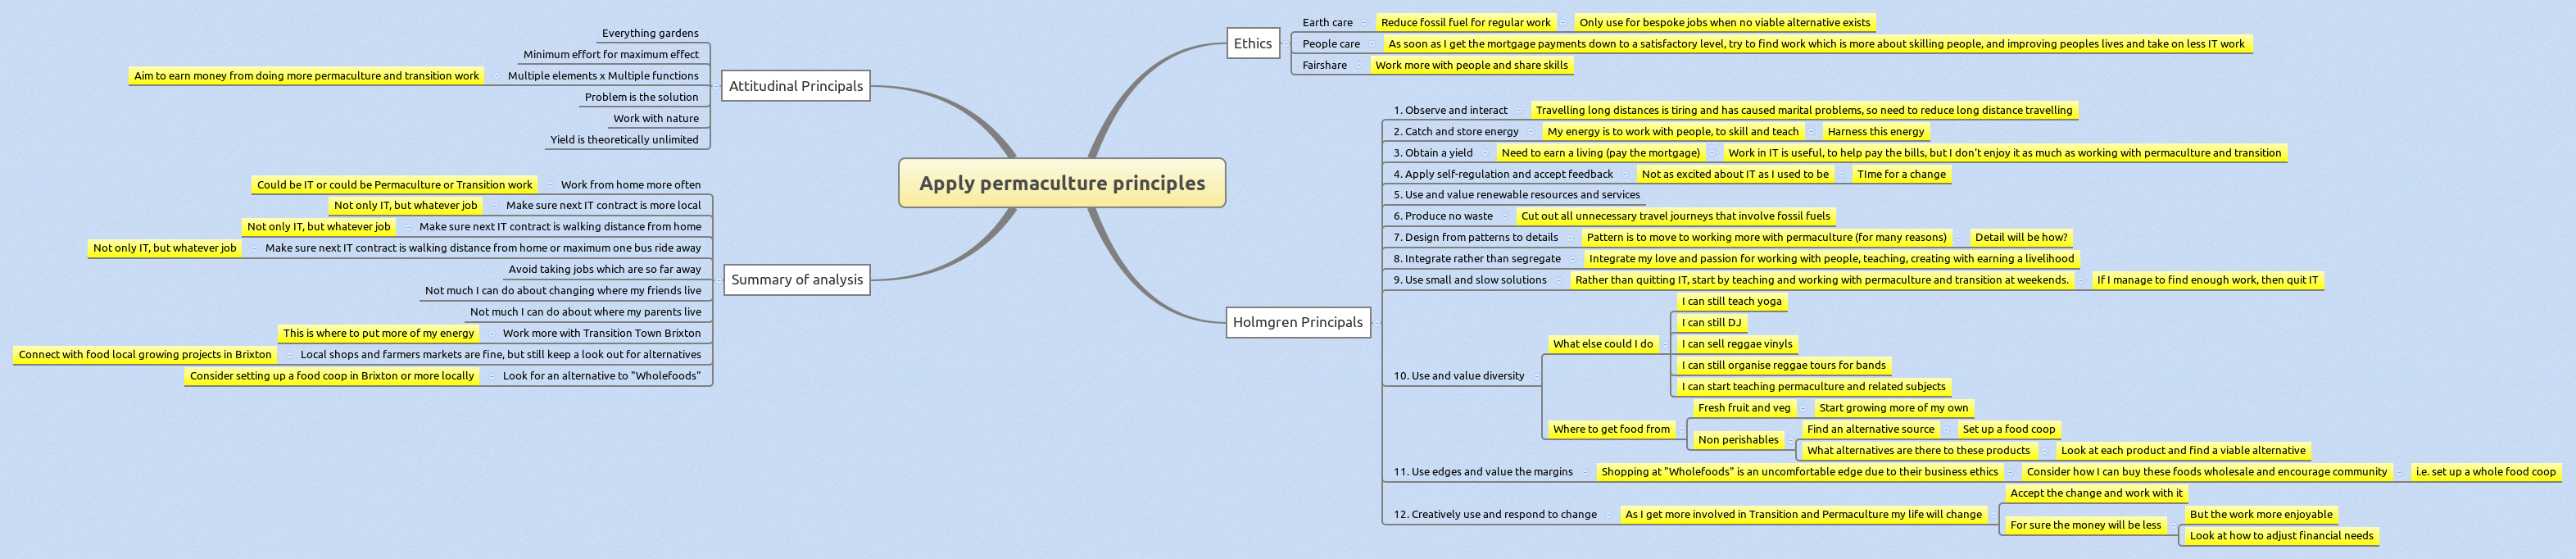
Apply principles
This stage is where the fun begins, I then take all the points summarised above and apply the permaculture principles to them. This brings out even more interesting ideas and juxtapositions. Just to reiterate, this is not a linear process as the mind map may indicate, I typically fill in the points that jump out and then systematically go through the rest. As an idea emerges, I then go over the points I may have already made notes on and see how a new idea may effect it. If necessary, it then gets modified and I move on. I keep going around this process many times until I am happy I have no more options to consider.
Click on the image below to view an interactive freemind mind map
Click on the image below to view the static Xmind mind map image
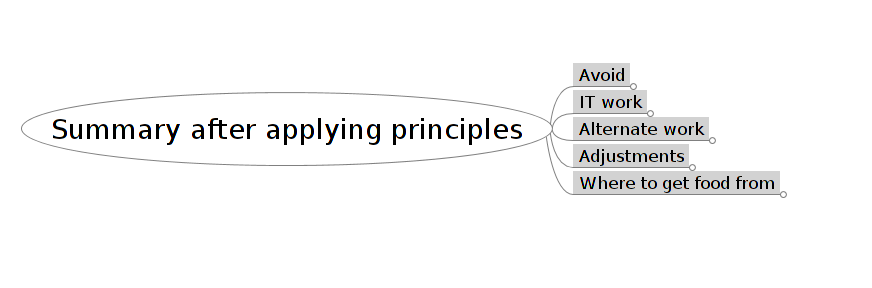
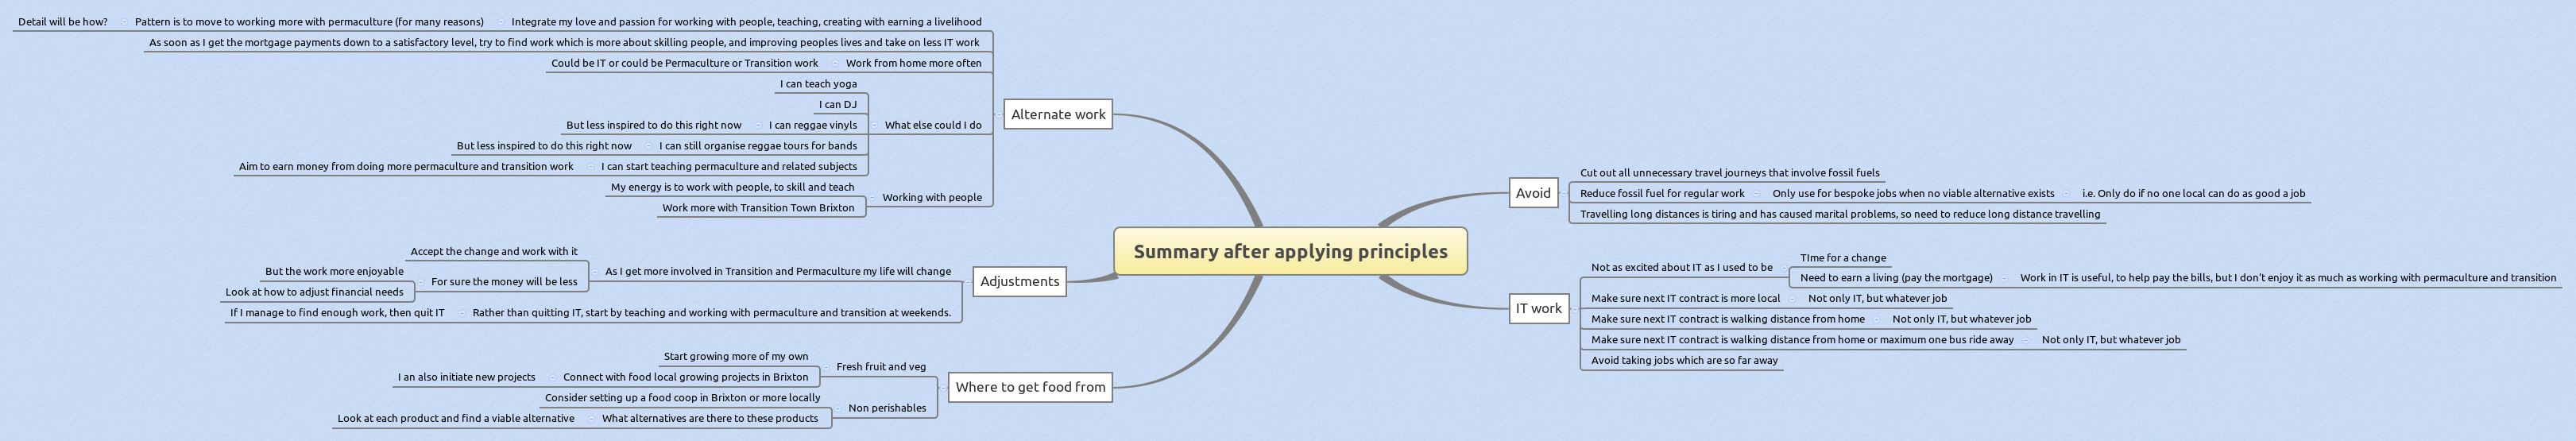
Summary after applying the principles
Once again I summarised all the points raised in the previous exercise and rearrange them under logical headings.
Click on the image below to view an interactive freemind mind map
Click on the image below to view the static Xmind mind map image
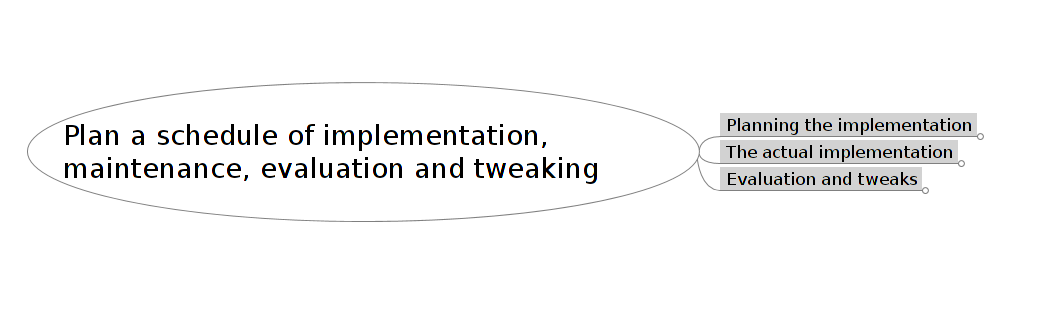
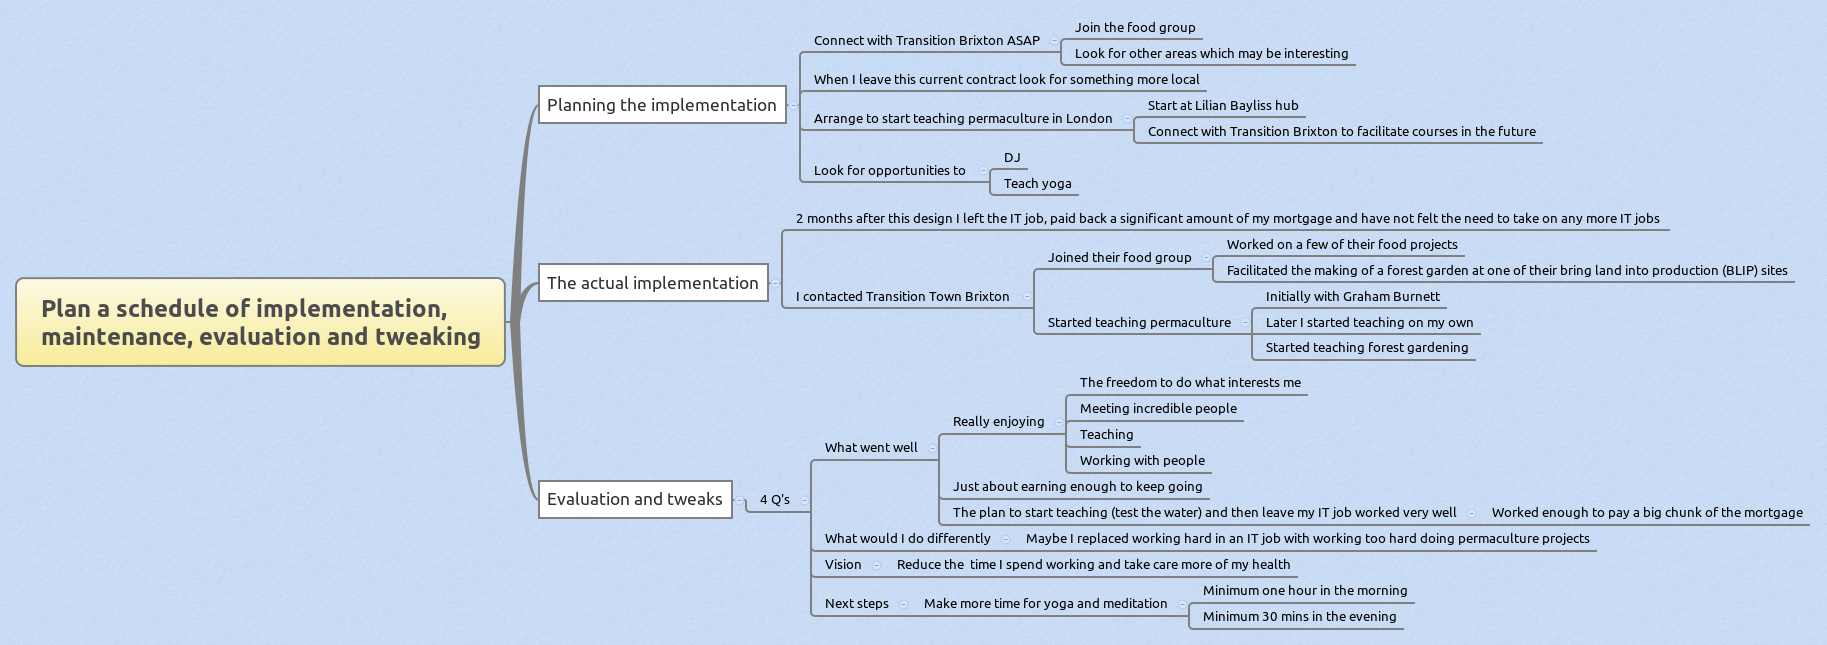
Plan, Implementation, Evaluation and Tweaks
This section covers the implementation phase, including how I intended to implement it as well as how I actually implemented it.
Click on the image below to view an interactive freemind mind map
Click on the image below to view the static Xmind mind map image
4. Summary
This was an extremely valuable exercise. It totally changed my life and lifestyle. It gave me a clear pathway on how to adjust my lifestyle to become more harmonious with nature as well as in harmony with what I wanted to achieve. It helped me to look at the most appropriate parameters which allowed me to see when was an appropriate time to leave a job and take on working full time as a permaculturalist. The most interesting observation about the exercise was noting how I thought I could not do much to influence where my friends live, yet a year on from making this statement, I realised that by working locally and taking on jobs no more then walking distance or a bus ride away changed my friends circle to being local. Meaning I made so many local friends by adopting this design, which is not something I was expecting.
Further update
Having implemented this successfully, my wife and I then left England and went back to Croatia. We decided to try living out there for a few years, and so I had to change the plan again. However this design still influences my choices. I have a clear idea when picking which jobs to take on and which not to take on. I have turned down many jobs based on whether someone local was better placed to deliver a course. Having said that I now do a lot of work abroad working with my spiritual family. I have a vested interest and a deeper understanding of their needs, so I feel justified in travelling to help them. When doing this I always make sure I connect with local teacher and practitioners, so that we can work together to develop the sites, so that I do not need to go over so often. This has proved very effective in places like Denmark, where I have a lovely team working to turn the massively underutilised farm into a buzzing hub of permaculture activity.